펭귄 (@babybluecream)
2025-11-30 | ❤️ 221 | 🔁 81
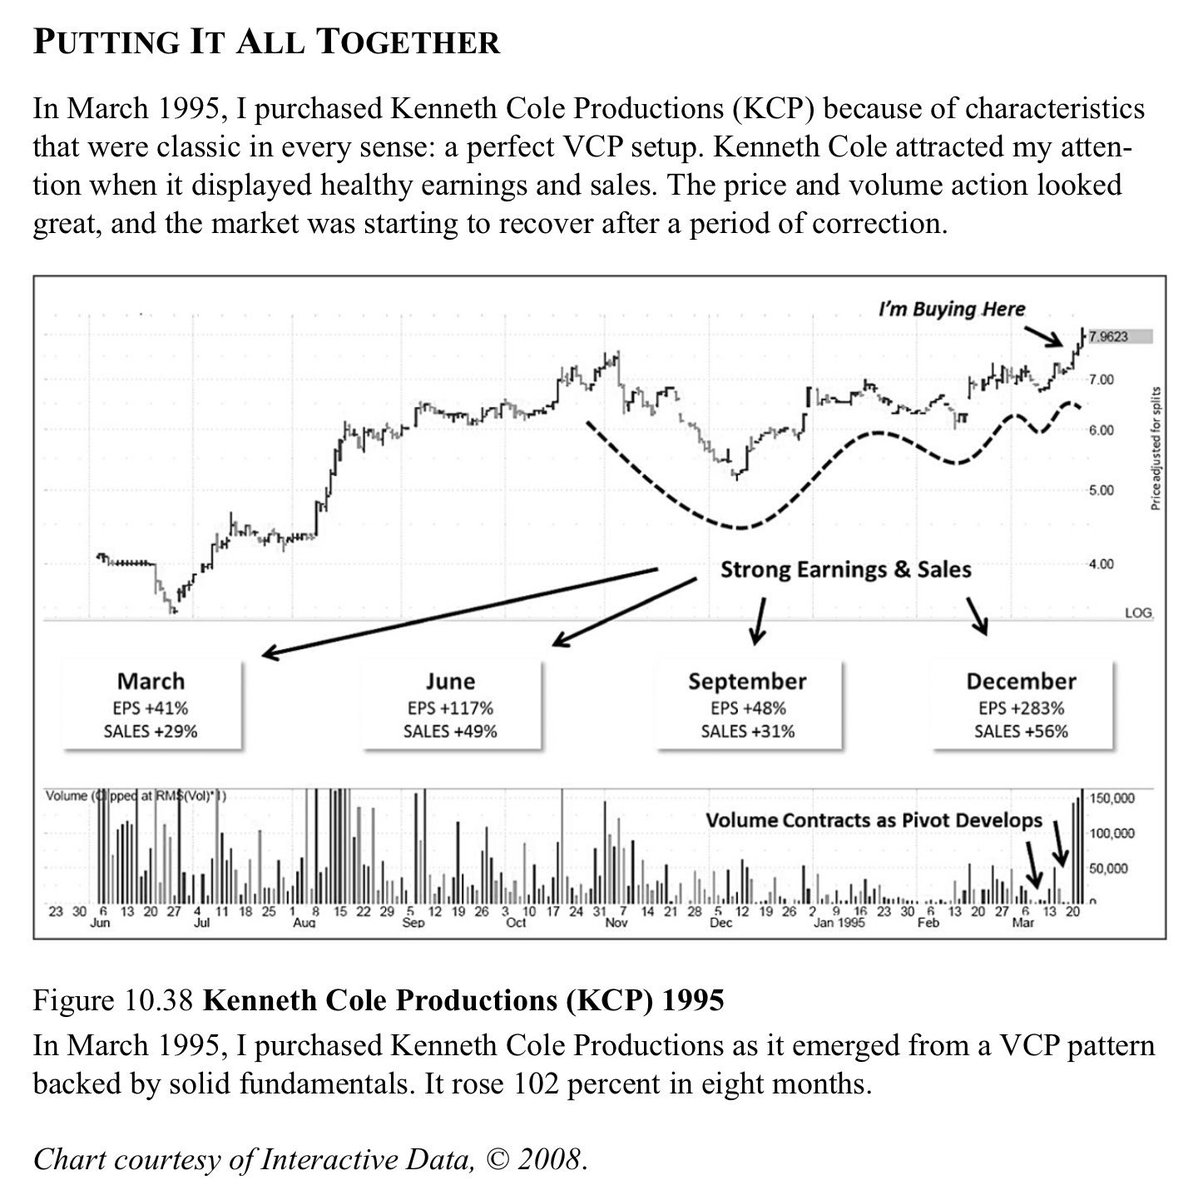
책 『Trade Like a Stock Market Wizard』 마크 미너비니 전략 정리🧃
-
스톡 스크리닝은 52주 최고가의 25% 이내인 주식 중에서 시작함.
-
주가가 30달러 미만인 종목은 배제함.
-
200일 이동평균선(MA)은 최소 3개월 이상 상승 추세를 이어가야 함.
-
50일 MA는 꼭 200일 MA 위에 위치해야 함.
-
현재 가격은 200일 이동평균선 위에 있어야 하고, 가능하면 50일 MA 위에도 위치해야 함.
-
주가는 52주 최저가 대비 최소 100% 이상 상승한 상태여야 함.
-
매 4~6개월마다 52주 최고가를 한 번 이상 갱신한 기록이 있어야 함.
-
매수 대상 주식 리스트는 매주 주간 종가 마감 후 작성함.
-
주간 차트를 기본 분석 도구로 삼음.
-
변동성 축소 패턴(VCP)은 가격과 거래량만으로 판단함.
-
강한 상승 시 양호한 거래량이 동반되고, 이후 하락하는 구간은 거래량이 줄면서 주가가 조정하는 형태를 이상적으로 봄.
-
일간 AMO 차트는 진입 시점 파악 용도로 활용함.
-
매일 신종목을 찾는데 집중하기보다 기존 보유 종목에 대한 추가 매수에 중점 둠.
-
돌파는 4~8주 이내에 발생해야 하며, 전체 승률은 50% 내외임을 감안함.
-
매수 후에는 녹색일과 적색일의 비율, 상승 거래량과 하락 거래량 비교, ‘테니스볼 액션’ 같은 시장 반응도 면밀히 체크함.
-
변동성 축소 패턴(VCP)은 한 주가가 세 번의 뚜렷한 변동성 축소를 겪어야 하며, 각 축소마다 변동성이 약 50% 감소하는 게 이상적임.
-
이전 고점 돌파 시점이 강력한 매수 신호로 작용함.
-
변동성 축소와 함께 시간 축소 현상 역시 중요한 신호로 봄
-
손절 규칙은 일일 차트에 20일 ATR(평균 진폭 폭)을 표시하고 이를 2배 곱한 수치를 최대 손실 폭으로 삼음. 또한 손실 폭은 10%를 넘기지 않는 것이 원칙임.
-
1995년 미너비니는 이러한 기준에 따라 종목 선정과 매매를 하면서 413% 수익률을 냈고, 이 전략은 강한 추세를 포착하고 리스크를 관리하는 데 효과적임.
-
기본적으로 마크 미너비니 전략은 과학적인 종목 선정과 엄격한 리스크 관리, 시장의 거래량과 가격 움직임에 대한 세밀한 관찰을 통해 승률을 높이고 손실을 최소화하는 체계화된 매매법임.
🔗 원본 링크
미디어

인용 트윗
Market Rebellion (@RebellioMarket)
Mark Minervini Setup How to find stocks
Screen stocks that are within 25% of their 52-week high
Eliminate the following stocks
Eliminate stocks trading below 30
200 MA is rising for at least 3 months
50 MA is above 200 MA
Current price is above 200 SMA and preferably above 50 too
Current price is at least above 100% from 52-week low
The stock should have made a 52-week high at least once every 4 to 6 months
Buying Pattern
Make stock list every week after weekly closing
Use weekly charts
Use Volatility Contraction Pattern (VCP)
Use only Price and Volume
Stocks moving up with good volume and then falling with lower volume (consolidating) is good
Use weekly charts
AMO daily charts are good for seeing setting of the stock
Look for volatility contraction in daily charts (just for looking entry)
You don’t need to find new candidates every day, try to add to existing position
Breakouts should happen between 4–8 weeks
Win rate is only 50%, so be prepared
Post Buying Monitoring
Follow up buying
Green days vs Red days
Up Volume vs Down Volume
Tennis Ball Action
Shallow Pullback
VCP Pattern
Volatility Contraction Pattern (VCP)
To calculate volatility contraction, divide swing low by swing high then -1 gives the % drop in volatility
There should be ideally 3 VCP
Each time volatility should decrease by ideally 50% (not a hard rule)
Buy when the previous swing high is taken out
With volatility, there is also time contraction which is very similar to price contraction
Take a stock for 2 VCP only if the second contraction is more than 70%
Stop Loss Calculation
Plot 20-period ATR on daily chart
Calculate 2× of the above value
Use this value as your stop loss
Use maximum of 10% as stop loss
Here’s Mark Minervini coming into the ‘95 uptrend based on what stocks met his criteria. He didn’t get really aggressive until April ‘95 - had an incredible 413% return that year! From ‘Trade Like A Stock Market Wizard’ - Minervini 2013